Table of Contents
Why measure FPS in embedded systems?
Measuring FPS in embedded systems helps quantify how responsive and smooth the user interface actually is under real hardware constraints. It provides a simple, comparable metric that makes it easier to detect performance issues, evaluate optimizations, and validate whether the system meets its requirements.
In practice, FPS is often used as a quick feedback signal during development – highlighting problems related to CPU load, memory bandwidth, or display throughput. While it does not tell the whole story, it is a useful starting point for understanding and improving overall UI performance.
How to measure FPS in embedded systems?
Measuring FPS (frames per second) in embedded systems is not as straightforward as in desktop environments. There is usually no built-in profiler, GPU counters, or standardized rendering pipeline. Instead, FPS must be derived from how and when the screen is actually updated.
In practice, FPS measurement is about answering one question:
How often does the system produce a fully rendered frame?
The answer depends on the graphics stack, rendering model, and display interface.
What does frame mean in embedded?
Before measuring FPS, it is important to define what a “frame” is.
In embedded systems, a frame can mean:
- full framebuffer update (common in double buffering)
- partial update (dirty areas only)
- display flush (transfer to display)
Because of this, FPS can be:
- render FPS – how often UI is drawn
- display FPS – how often pixels are sent to display
These are not always the same.
In this example we will focus on render FPS.
STM32 / Bare metal (Generic approach)
On MCU systems (e.g. STM32), FPS is often measured using a timer or cycle counter.
Approach:
- increment frame counter at end of rendering loop
- measure elapsed time using SysTick or DWT cycle counter
volatile uint32_t frame_count = 0;
void render_frame(void)
{
// draw UI
frame_count++;
}
Then in a periodic task:
void fps_task(void)
{
static uint32_t last = 0;
uint32_t now = HAL_GetTick();
if (now – last >= 1000) {
printf(“FPS: %lu\n”, frame_count);
frame_count = 0;
last = now;
}
}
What this measures:
- render FPS
Alternative (more precise):
Use DWT->CYCCNT register to measure exact frame time in CPU cycles.
A more precise way to measure FPS on STM32 (and Cortex-M in general) is to use the DWT cycle counter (DWT->CYCCNT), which counts CPU clock cycles instead of relying on millisecond system ticks.
How it works:
At the beginning of a frame, you store the current value of CYCCNT. At the end of the frame, you read it again and compute the difference. This gives you the exact number of CPU cycles spent rendering a single frame. Knowing the CPU frequency, you can calculate FPS:
FPS = CPU_frequency / cycles_per_frame
Advantages:
- Very high precision (cycle-level accuracy)
- Ideal for performance analysis and optimization
- Not affected by SysTick interrupts or scheduling jitter
Disadvantages:
- Requires a known and stable CPU clock frequency
- Not available on all Cortex-M cores (e.g. M0/M0+)
- Slightly more complex to set up and use
- Counter overflow must be considered in longer measurements
LVGL Performance Monitor (LV_USE_PERF_MONITOR)
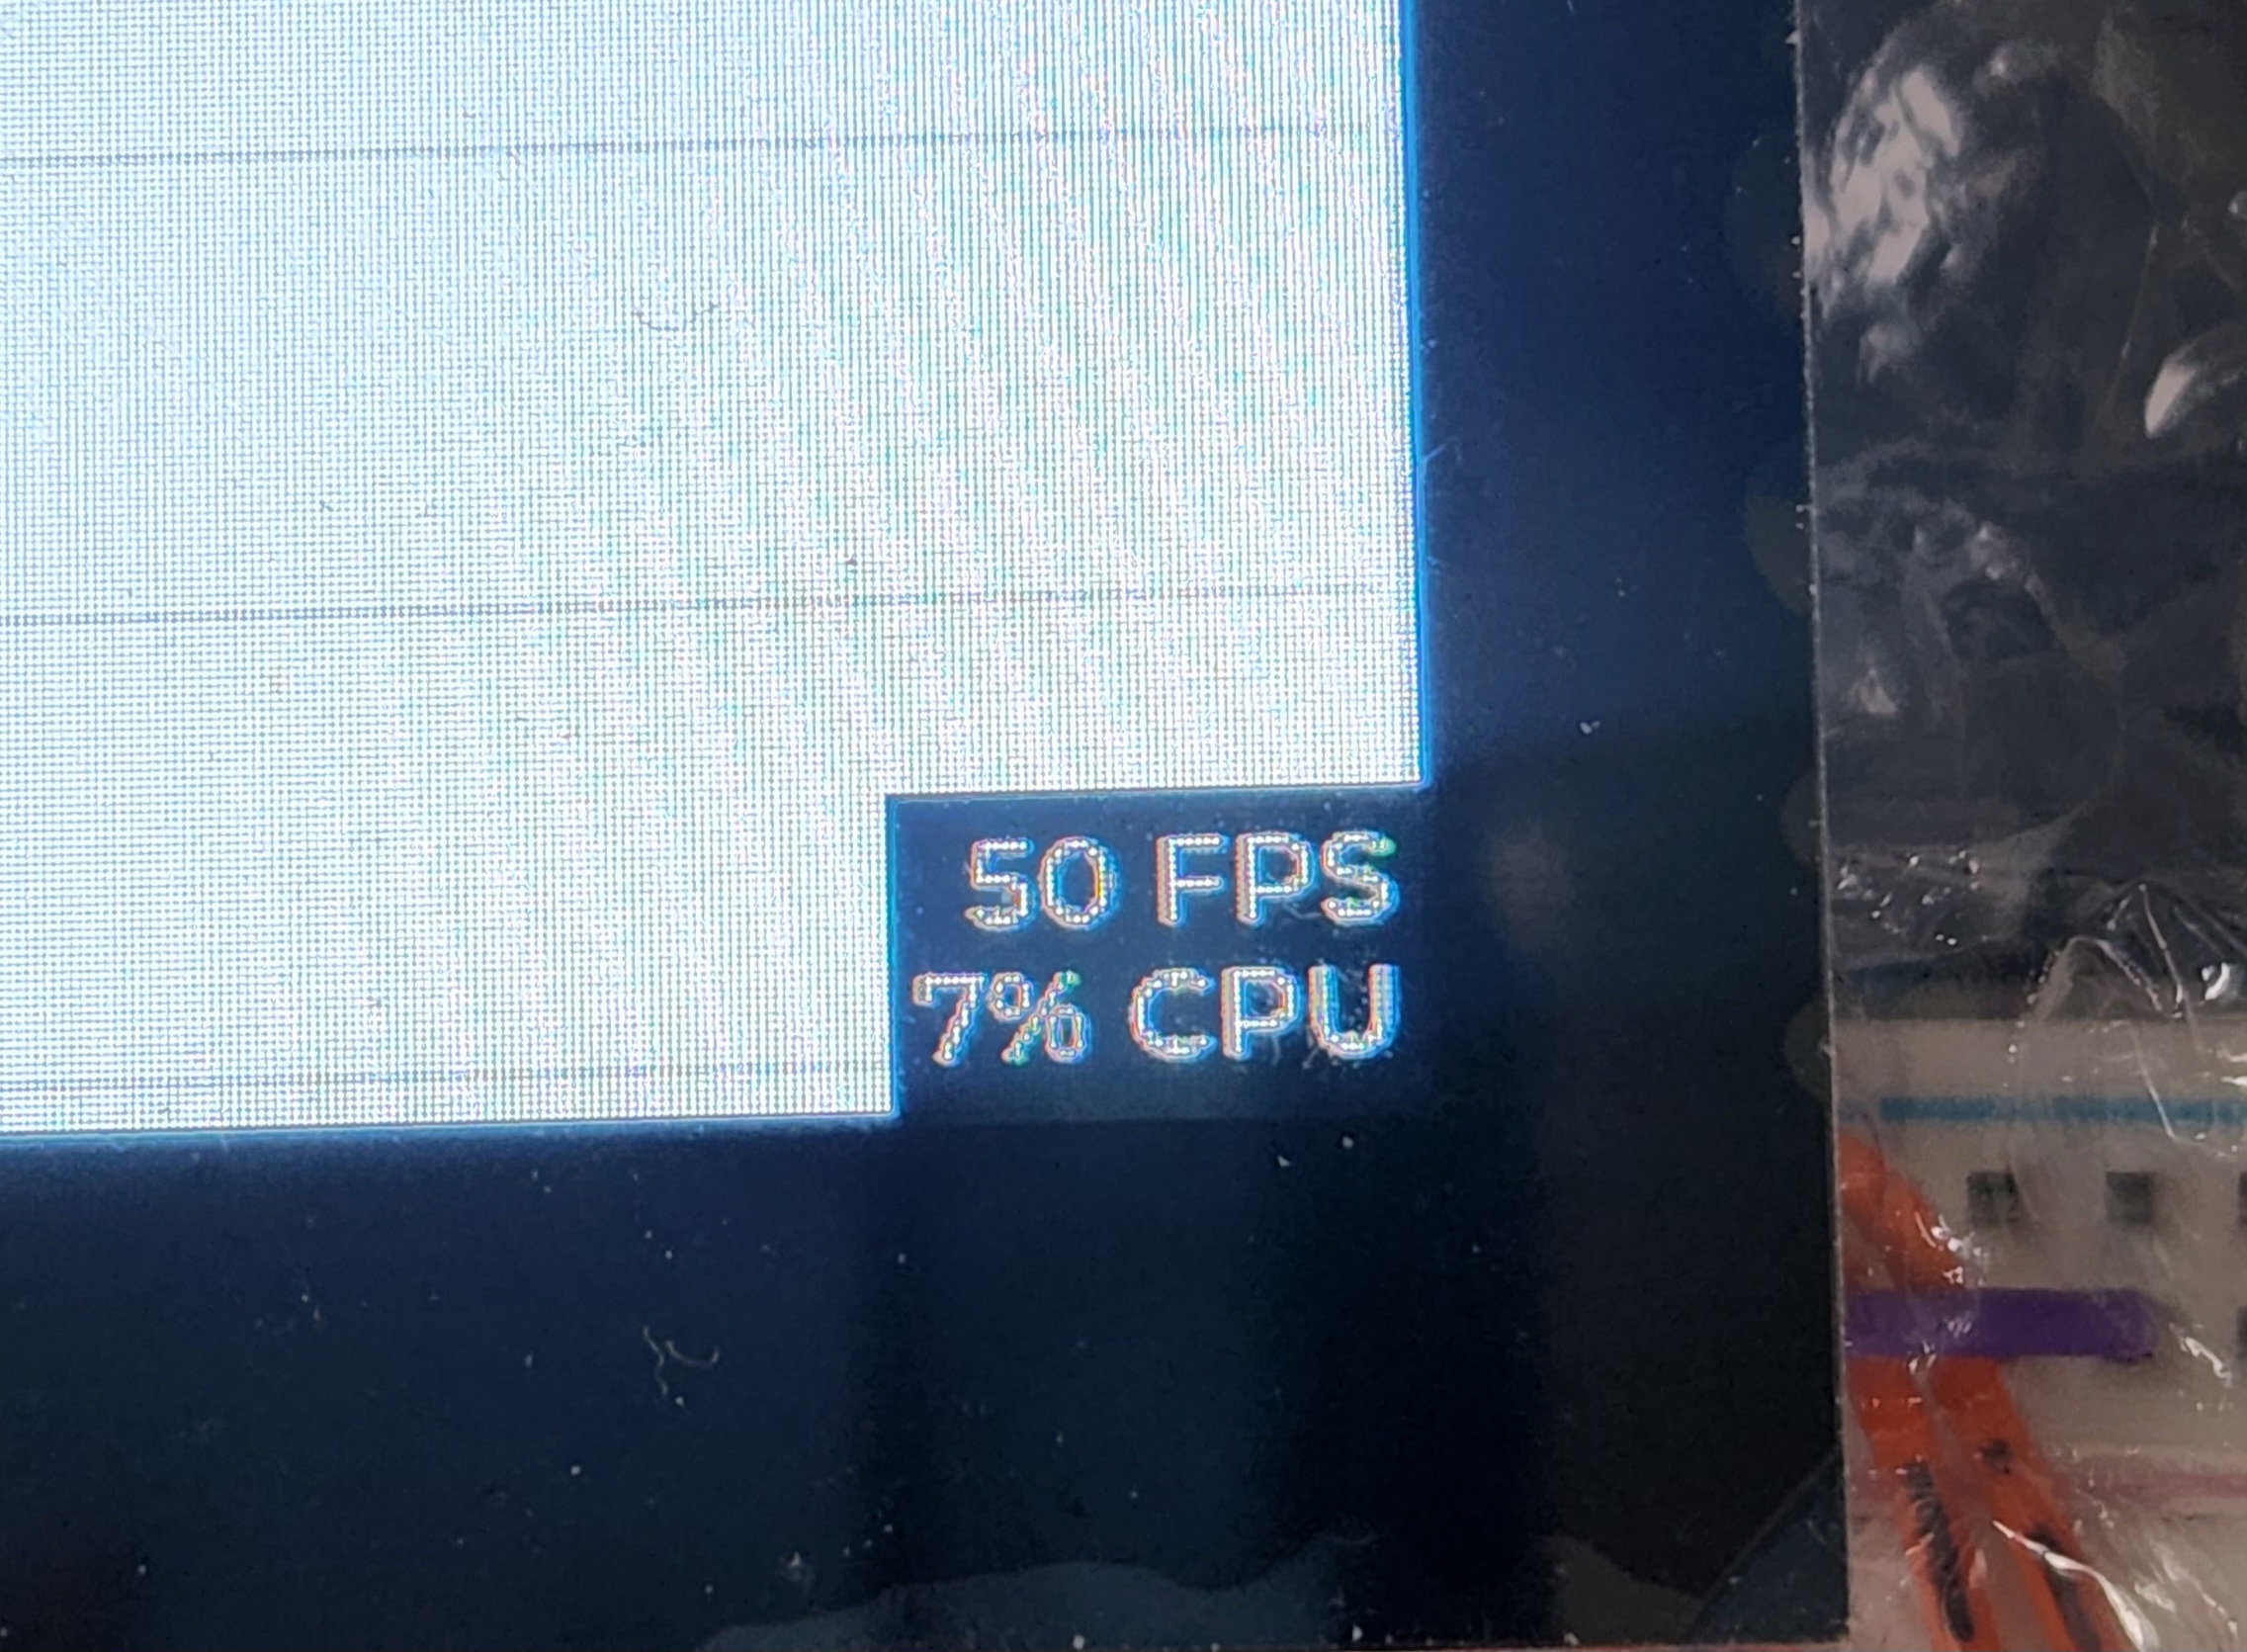
LVGL provides a built-in way to monitor performance by enabling the LV_USE_PERF_MONITOR option in the configuration (lv_conf.h). When enabled, LVGL displays a small on-screen overlay with real-time metrics.
This typically includes:
- FPS (frames per second)
- CPU usage (time spent in LVGL tasks)
- sometimes memory-related stats (depending on configuration)
The monitor works internally by tracking how often the rendering loop runs and how much time is spent processing tasks and drawing.
What this measures:
- a mix of render FPS and system load
- closer to “UI performance” than raw display FPS
Why it’s useful:
- zero-effort setup (just enable in config)
- immediate visual feedback during development
- great for quick performance validation and regression checks
Limitations:
- does not measure actual display transfer time (flush to screen)
- FPS may not reflect full-screen updates when partial redraw is used
- adds slight overhead (should be disabled in production)
In practice, LV_USE_PERF_MONITOR is the fastest way to get a rough understanding of system performance, but for precise measurements – especially when optimizing bandwidth or display drivers – it should be combined with lower-level timing (e.g. measuring flush callbacks).
MPU/Linux
On Linux systems, FPS measurement depends on the graphics stack.
Simple framebuffer (fbdev)
Measure time between buffer swaps:
clock_gettime(CLOCK_MONOTONIC, &t1);
// render + memcpy to framebuffer
clock_gettime(CLOCK_MONOTONIC, &t2);
Wayland / GUI frameworks
Options include:
- built-in tools (e.g. Weston FPS counter)
- app-level timing
- GPU profiling tools (if available)
Conclusions
Measuring FPS in embedded systems requires understanding what a “frame” actually represents in a given pipeline. Whether you measure render loops, flush callbacks, or buffer swaps, each method reflects a different aspect of performance. Frameworks like LVGL or Linux-based stacks provide useful hooks, but it is up to the developer to choose the right measurement point.
In practice, FPS alone is not enough. Frame time consistency, latency, and memory bandwidth often have a greater impact on perceived performance. A stable and predictable frame rate is usually more important than achieving the highest possible FPS.
DISCOVER OUR
Whitepaper
Achieve the perfect user-display interaction with the right Touch Sensor IC. Ever faced issues with phantom touch events or certification? Boost your R&D like a pro with our Whitepaper!
Go to our product catalog and see how you can save by quality, not on quality.